Uptime Monitoring for Web Developers

Monitoring should be calm. Site Informant focuses on clean signal, predictable checks, and data you can automate. Track uptime, response time, SSL health, and key metadata without a pile of noisy alerts.

Built by engineers. Designed for real production workflows.
Site Informant dashboard showing uptime percentage, response time graphs, and status results.

Why developers use uptime monitoring

Because the first sign of a problem is often a customer message. A quiet monitor lets you catch failures, slowdowns, and SSL issues before they become a fire drill.

Clean signal
Uptime and performance trends you can reason about. Not a wall of noise.
Fast feedback loops
See response-time drift early so you can act before users feel it.
SSL visibility
Expiration dates and issuer details, tracked continuously.
Developer-first automation
Structured JSON data for scripts, reporting, incident workflows, and AI tools.

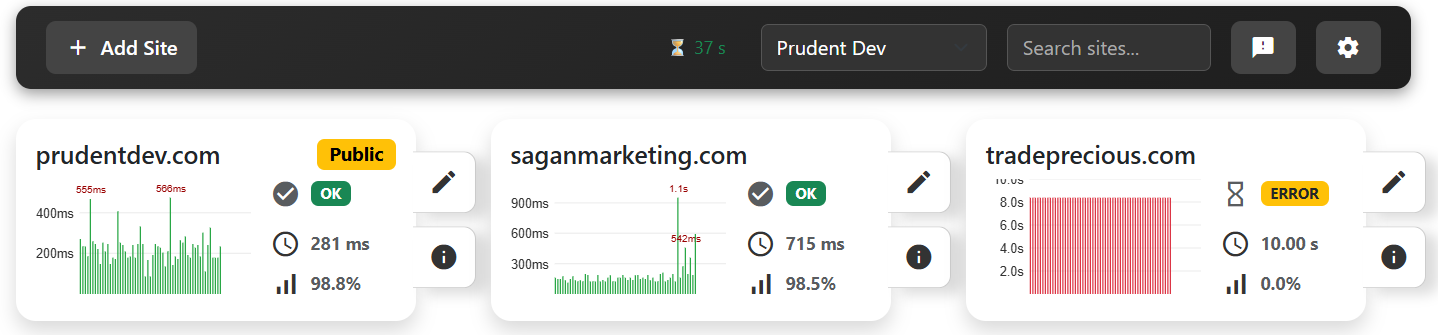
What you can monitor

Uptime checks
Availability monitoring with clear history.
Response time
Track performance changes, not just failures.
SSL health
Expiration, issuer, TLS protocol metadata.
Network metadata
IP resolution, connectivity results, timing.

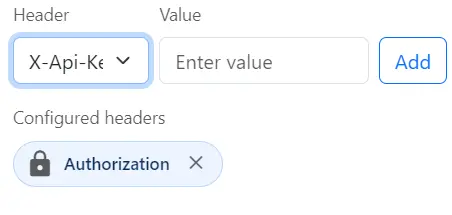
Monitor authenticated endpoints

Many developer endpoints require authentication. Site Informant supports attaching request headers for monitoring protected routes. Values are stored encrypted and are never shown publicly.

  • Authorization
  • X-Api-Key
  • Accept
  • User-Agent
Adding request headers for monitoring authenticated endpoints in Site Informant.
Add auth headers once. Site Informant uses them during checks and stores values encrypted.

How it works

1. Add your endpoint
Add a site or API endpoint and choose notification preferences.
2. Site Informant checks it
Predictable checks with response timing, SSL metadata, and clean history.
3. Use the data
Dashboard for visibility, JSON for automation, reporting, and AI workflows.

FAQ

You can monitor both. Many users start with a website, then add health endpoints and protected API routes. If your endpoint needs authentication, you can attach request headers.

The goal is low-noise monitoring. Alerts are meant to be meaningful, not constant. You can enable only what you want, such as uptime changes or SSL expiration.

Yes. That is a core use case. Use the dashboard for quick visibility, and the JSON API for automation, reporting, and AI workflows.

Start monitoring in under a minute

Calm monitoring for developers who want clean signal and clean data.

Create My Account